4.1 Gear Types
Fishermen from Morro Bay primarily use the following gear types:
4.2 Commercial Fishery
4.2.1 Fleet Description
In 2021, 71 of the state’s 6,650 commercial fishing license holders reported Morro Bay as their home address, 87 of the state’s approximately 1,674 active commercial fishing vessels landed catch at the port, 116 of the state’s 3,148 registered commercial fishing vessels were homeported at Morro Bay. (Note: License counts are based on addresses in Morro Bay and do not include neighboring communities. For all state licenses count does not reflect those with out-of-state addresses. For vessels registered with the US Coast Guard, owner mailing address city was used to determine home port.) The number of fishing license holders in Morro Bay climbed from 161 in 1998 to 213 in 2000 but then gradually declined to 95 in 2008. They increased again to 115 in 2012, before declining again to 71 in 2021 (Figure 10). Landings in two of the port’s primary fisheries, groundfish and salmon, declined overall from 1989 to 2021, however, each briefly saw an increase in landings in the 2010s, with Dungeness crab, which likely contributed to the spike in fishing licenses during that same period. Morro Bay-based fishers are slightly older on average than California fishers as a whole: the average age of commercial fishing license holders in Califorinia in 2021 was 49, with a median age of 48, whereas in Morro Bay the average age was 53 and the median age was 54.
Figure 10: Commercial Fishing License Holders in Morro Bay 1998-2021
For several state- and federally managed fisheries, a fishery-specific permit is required. In some cases such as the state-managed Nearshore Fishery (which covers 19 species, most of them rockfishes), the permit is assigned to the fisherman. In others such as the federally managed groundfish trawl fishery, the permit is assigned to the vessel. Fishing permits in 2021 (Figure 11) that were either linked with vessels homeported in Morro Bay or to fishers with a Morro Bay address included: 20 nearshore permits and 18 deeper nearshore permits, 13 resident Dungeness crab permits, 8 rock crab permits, and 60 salmon stamps (58 salmon vessel permits). Salmon stamps are an indicator of the number of fishermen participating in commercial salmon fishery and typically are not limited; salmon vessel permits are restricted and are an indicator of the number of vessels/operations allowed to participate in the fishery.
Figure 11: Commercial fishing permits by type held by fishers and vessels with a Morro Bay address and statewide, in 2021
CaliforniaMorro Bay
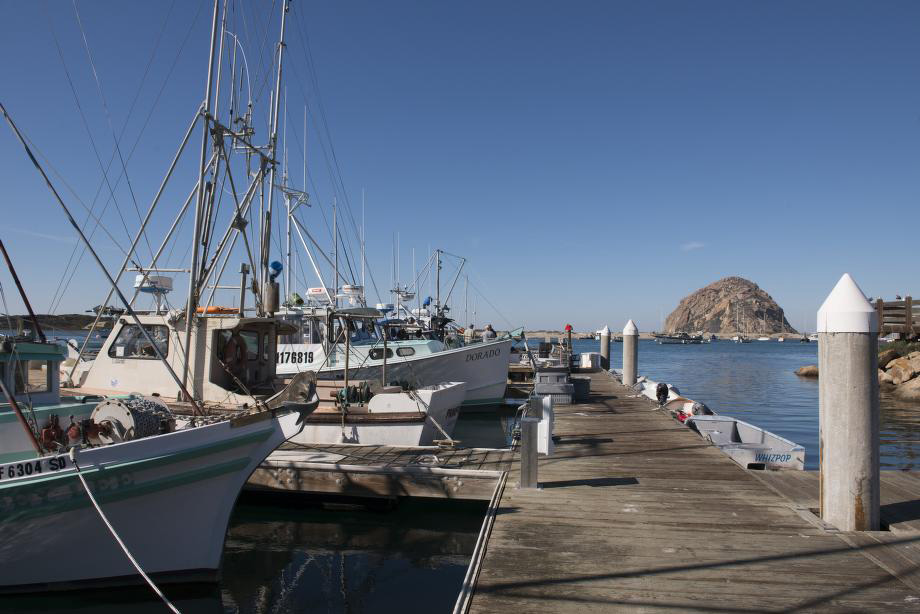
The number of Morro Bay commercial fishing vessels has fluctuated over time (Figure 12). Between 1990 and 1998 the resident fleet shrank by about one-third (68 vessels), and between 1998 and 2000 the resident fleet shrank again by about one-third (42 vessels). This contraction is largely a result of declines in the groundfish fishery, which prompted the 2000 Federal fishery disaster declaration, and led to the subsequent vessel buyback program which removed trawl vessels from the fleet, though Morro Bay did not lose any vessels from its homeported fleet. However, in 2006 The Nature Conservancy led a second buyback in which a combined total of 13 trawl vessels and permits were removed from the Morro Bay fleet. From 2000 to 2015 the fleet grew 50% (52 vessels). In 2021, vessels homeported at Morro Bay averaged 30 ft in length, ranging from 12 to 61.8 ft, with a median length of 31 ft (Figure 13).
Figure 12: Commercial fishing vessels homeported at Morro Bay and average vessel length 1989-2021
Figure 13: Commercial fishing vessels homeported in Morro Bay by length in 2021
4.2.2 Primary Fisheries and Trends
In terms of commercial landings for the period 1992-2021 (Figure 14), groundfish and market squid have been the top two fisheries, together accounting for 74% of landings at the port (Figure 15). In terms of ex-vessel value for the period 1992-2021 (Figure 16), groundfish and Dungeness crab have been the top fisheries, together accounting for 62% of ex-vessel value at the port.
Figure 14: Top Commercial Fisheries for Morro Bay for periods, 2021, 2017-2021, 1992-2021
Dungeness crabGroundfishSalmon Market squid Other
Ex-Vessel Value
Percent of total ex-vessel value for the port's primary fisheries.
Weight
Fisheries with more than ten percent of total port catch weight.
Figure 15: Commercial landings (by weight) at Morro Bay for top fisheries and all else, 1989-2021*
* The dataset for this graph has been redacted to remove data deemed confidential by California Department of Fish and Wildlife. CDFW does not publicly release data pertaining to three or fewer fishers, vessels, or businesses.
Figure 16: Ex-vessel value of commercial landings at Morro Bay for top fisheries and all else, 1989-2021*
* The dataset for this graph has been redacted to remove data deemed confidential by California Department of Fish and Wildlife. CDFW does not publicly release data pertaining to three or fewer fishers, vessels, or businesses.
Although groundfish value has increased, annual groundfish landings dropped substantially through the 2000s after the 2000 groundfish disaster (Figure 17). As Figures 18 and 19 show, the distribution of catch among groundfish species groups (e.g. nearshore rockfish, shelf and slope rockfish, and sablefish) shifted with implementation of the Nearshore Fishery Management Plan and the establishment of the Federal Rockfish Conservation Area (Table 2) (Source). The TNC buyout program also shifted focus from high volume trawl caught species to lower volume and higher value species that could be caught with fixed gear.
Figure 17: Morro Bay commercial groundfish fishery landings and ex-vessel value, 1989-2021
Figure 18: Ex-vessel value of commercial landings of groundfish species groups at Morro Bay, 1989-2021*
* The dataset for this graph has been redacted to remove data deemed confidential by California Department of Fish and Wildlife. CDFW does not publicly release data pertaining to three or fewer fishers, vessels, or businesses.
Figure 19: Weight of commercial landings of groundfish species groups at Morro Bay, 1989-2021*
* The dataset for this graph has been redacted to remove data deemed confidential by California Department of Fish and Wildlife. CDFW does not publicly release data pertaining to three or fewer fishers, vessels, or businesses.
Among the other commercial fisheries with landings at Morro Bay are salmon, highly migratory species, hagfish and spot prawn. Although salmon landings and ex-vessel value have been declining since the 1980s due to declining salmon returns and habitat issues, it remains one of the most important fisheries for fishers at Morro Bay and along much of the coast (Figure 20). Salmon’s importance is reflected in the number of permits (associated with vessels) and stamps (associated with fishing licenses) held in Morro Bay in 2018, which was the highest proportion of permits there, even though salmon accounts for a small proportion of total landings and ex-vessel value at the port.
Figure 20: Morro Bay commercial salmon fishery landings and ex-vessel value, 1989-2021*
* The dataset for this graph has been redacted to remove data deemed confidential by California Department of Fish and Wildlife. CDFW does not publicly release data pertaining to three or fewer fishers, vessels, or businesses.
Highly migratory species accounted for 9% of the total value of landings at the port from 1992-2021, though most of these landings occurred from 1999-2001 (Figure 21). Spot prawn was a significant fishery through the 1990s, but landings have been less significant into the 2000s (Figure 22). Hagfish (a relatively new fishery) made up 5% of total port landings by weight in the period 2017-2021 (Figure 23).
Figure 21: Morro Bay commercial highly migratory species fishery landings and ex-vessel value, 1989-2021
Figure 22: Morro Bay commercial spot prawn fishery landings and ex-vessel value, 1989-2021*
* The dataset for this graph has been redacted to remove data deemed confidential by California Department of Fish and Wildlife. CDFW does not publicly release data pertaining to three or fewer fishers, vessels, or businesses.
Figure 23: Morro Bay commercial hagfish fishery landings and ex-vessel value, 1989-2021*
* The dataset for this graph has been redacted to remove data deemed confidential by California Department of Fish and Wildlife. CDFW does not publicly release data pertaining to three or fewer fishers, vessels, or businesses.
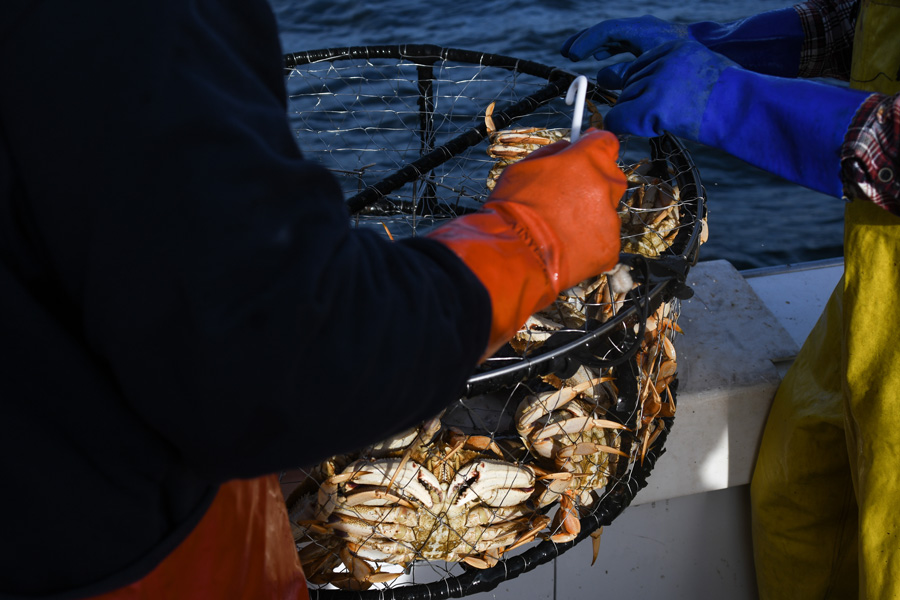
More recently, from 2017-2021 market squid, groundfish, and Dungeness crab were Morro Bay’s top fisheries in terms of landings (Figure 15). For the same period, groundfish, Dungeness crab and salmon were Morro Bay’s top fisheries in terms of ex-vessel value (Figure 15). Dungeness crab is a relatively recent fishery to the port, growing dramatically since 2010 as other fisheries such as salmon went into decline (Figure 24). The market squid fishery had steep declines in landings due to environmental factors in the late 2010s, however, they soon increased to record highs in terms of both landings and value in 2014. Market squid fishery constituted 8% of the value and 35% of landings for the period 2017-2021 (Source).
Figure 24: Morro Bay commercial Dungeness crab fishery landings and ex-vessel value, 1989-2021
Figure 25: Morro Bay commercial market squid fishery landings and ex-vessel value, 1989-2021*
* The dataset for this graph has been redacted to remove data deemed confidential by California Department of Fish and Wildlife. CDFW does not publicly release data pertaining to three or fewer fishers, vessels, or businesses.
4.3 Recreational Fishery
Of the state’s 622 licensed Commercial Passenger Fishing Vessels (CPFV)––for-hire recreational fishing boats––in 2021, nine (1%) are homeported in Morro Bay, accounting for 3% of trips statewide. Based on CPFV trip logs and landings data, the primary recreational fishery is nearshore groundfish; rockfish species and lingcod are the most targeted species. These numbers do not reflect recreational fishing conducted on private vessels or shoreside. Rockfish catches accounted for 99% of all for-hire landings at the port in 2021 (Figure 26). Because Morro Bay has historically been an important port for rockfish sport (and commercial) fishing, increasingly stringent federal fishery management measures and the groundfish disaster in 2000 led to a significant drop in fishing activity, with profound implications for the port and the larger community. Albacore tuna was briefly targeted from the late 1990s to the early 2000s when groundfish catches were down.
In 2021, the nine CPFVs homeported at Morro Bay reported a total of 1072 trips. Based on the CPFV logbook data for 1989-2021, the number of reported CPFV trips declined by 85% from 1989 to 1999 leading up to the federal groundfish fishery disaster declaration. (Note: The precise data on numbers of trips cannot be reported for most years for Morro Bay due to confidentiality rules when there are fewer than three vessels in a port in a given year.) Since 1999 trips have slowly increased. Averaged over the years 1989-2021, rockfish accounted for 96%, lingcod accounted for 3% and Albacore tuna accounted for 1% of CPFV landings (Figure 26). Landings reflect a similar pattern, dropping from more than 350,000 in 1989 to about 50,000 in 1999 (Figure 27). Landings increased to around 75,000 fish in the early 2010s and then consistently climbed most years, increasingly to roughly 330,000 in 2021.
Figure 27: CPFV landings at Morro Bay, 1989-2021
4.4 Fishery Management
California’s commercial and recreational fisheries are variously governed by a mix of state and federal entities with distinct and overlapping management authorities depending on the species and sector. State management authority lies with the Legislature, the Fish and Game Commission and the Department of Fish and Wildlife (CDFW). Federal authority lies primarily with the Pacific Fishery Management Council (PFMC) and the National Marine Fisheries Service (NMFS). Other state and federal entities also play a role in the governance of some fisheries.
Information about management of this port's primary fisheries:
For Morro Bay’s primary fisheries Table 3 summarizes relevant management authorities and measures and Figure 28 summarizes seasonality as of 2018-19.
| Management Authority | Management Measures | ||||||
|---|---|---|---|---|---|---|---|
| Fishery | State | Federal | Limited Entry | Catch/Bag Limits | Time/Area Closures | Species Size/Sex Rules | Gear Restrictions |
| Dungeness Crab Pot | ✓ | ✓ | ✓ | ✓ | ✓ | ✓ | |
| Groundfish hook-and-line, trap, trawl | ✓ | ✓ | ✓ | ✓ | ✓ | ✓ | ✓ |
| Hagfish trap | ✓ | ✓ | |||||
| Pink (ocean) shrimp trawl | ✓ | ✓ | ✓ | ✓ | ✓ | ✓ | |
| Market squid purse seine | ✓ | ✓ | ✓ | ✓ | ✓ | ✓ | |
| HMS (swordfish and shark) drift gillnet | ✓ | ✓ | ✓ | ✓ | ✓ | ✓ | |
Note: Management authority and /or measures for a given fishery may vary depending on species, region fished, and/or gear type.
Note: There are a variety of Catch/Bag Limit tools which vary by fishery and sector. Commercial: individual transferable quotas, individual (i.e., daily or periodic e.g., bimonthly, area-based) within-season catch limits, fishery-wide (annual or intra-seasonal) quotas, in most cases based on a TAC. Recreational: bag/daily catch limits, in some cases based on a TAC.
Figure 28: Seasonality of Selected Central Coast California Fisheries, 2018-19 (adapted from Culver & Pomeroy)
| Jan | Feb | Mar | Apr | May | Jun | Jul | Aug | Sep | Oct | Nov | Dec | |
|---|---|---|---|---|---|---|---|---|---|---|---|---|
| Blackcod (sablefish)* | ||||||||||||
| Coastal pelagic species finfish | ||||||||||||
| Crab, Dungeness | ||||||||||||
| Crab, rock | ||||||||||||
| Hagfish | ||||||||||||
| Halibut, California | ||||||||||||
| Rockfish* | ||||||||||||
| Roundfish | ||||||||||||
| Salmon, Chinook | ||||||||||||
| Shrimp, pink (ocean) | ||||||||||||
| Squid, market |
Peak activity Low to moderate activityClosed or no activity
Notes: Seasonality is based on 2018-19 regulations, resource availablity off California's North Coast, and market demand, and may vary from year to year due to these and other factors. Some fisheries use multiple gear types and/or target multiple species. *Groundfish species
Source: CDFW 2018-19 monthly landings & Commercial Fisheries Digest 2018-19
4.5 Fishing Organizations
| Fishing Organization | Geography | Species/Gear |
|---|---|---|
| Alliance of Communities for Sustainable Fisheries | Central CA Regional | All |
| California Coast Crab Association | State | Crab |
| California Salmon Council | State | Salmon |
| Central California Joint Cable/ Fisheries Liaison Committee | San Luis Obispo County Regional |
Trawl |
| Central Coast Women for Fisheries (all sectors) | Local | All |
| Joint Oil Fisheries Liaison Office | Santa Barbara Channel Regional |
All |
| Morro Bay Commercial Fishermen's Organization | Local | All |
| Morro Bay Community Quota Fund | Local | Groundfish |
| Pacific Coast Federation of Fishermen’s Associations | State | All |
| Small Boat Commercial Salmon Fishermen's Association | West Coast | Salmon |
| Southern California Trawlers’ Association | Regional | Trawl |
All organizations serve the commercial sector unless otherwise noted. Organization name linked to website when available.